

Introduction
The working details of the assignment are as follows
Power Quality
Power quality relates to the ability of the electric system to deliver electricity that meets thoserequirements. For an electrical system to have good power quality, proper wiring andgrounding techniques must be used. Poor power quality can waste energy and the capacity of an electrical system. It can harm both the electrical distribution system and devices operating on the system. As more electronic devices are connected to power systems, the “quality” of the power becomes more important. “Quality” can be defined in many ways. Stable voltages and undistorted waveforms are two characteristics, which are very desirable in power systems. Grounding affects voltage stability, and more importantly, is critical to personal safety.
Power Quality can be defined as any power problem manifested in voltage, current or frequency deviations that result in failure or misoperation of an equipment. The IEEE defined power quality disturbances have been organized into below categories based on wave shape:
Transients
Potentially the most damaging type of power disturbance, transients fall into two subcategories, Impulsive and Oscillatory.
Impulsive
Impulsive transients are sudden high peak events that raise the voltage and/or current levels in either a positive or a negative direction. These types of events are further categorized by the speed at which they occur, fast, medium, and slow. The impulsive transients are also known as surge, spike, bump, and glitch or power surge.
- Impulsive transients can be very fast events (5 nanoseconds [ns] rise time from steady state to the peak of the impulse) or of short-term duration (less than 50 ns).
- 1000 ns = 1 μs] [1000 μs = 1 ms] [1000 ms = 1 second]
- Lightning
- Poor Grounding
- Switching of inductive Loads
- Utility Fault Hearing
- ESD – Electro-Static Discharge
- Loss(corruption) of Data
- Physical damage of electronic equipment’s like PCB Cards, SMPS and UPS
- Transient Voltage Surge Suppressors
- Surge Protective devices
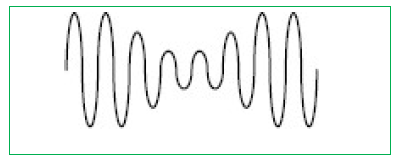
Oscillatory Transient
An oscillatory transient is a sudden change in the steady-state condition of a signal's voltage, current, or both, at both the positive and negative signal limits, oscillating at the natural system frequency. In simple terms, the transient causes the power signal to alternately swell and then shrink, very rapidly. Oscillatory transients usually decay to zero within a cycle (a decaying oscillation).
Causes
Switching off an inductive or capacitive load, such as a motor or capacitor bank for example, upon turning off a spinning motor, it acts briefly as a generator as it powers down, thereby producing electricity and sending it through the electrical distribution. A long electrical distribution system can act like an oscillator when power is switched on or off, because all circuits have some inherent inductance and distributed capacitance that briefly energizes in a decaying form. Osci llatory transients can be quite disruptive to electronic equipment’s.
Effects
Tripping of Adjustable speed drives The relatively slow transient causes a rise in the dc link voltage (the voltage that controls the activation of the ASD), which causes the drive to trip off-line with an indication of overvoltage.
Solution
- Line reactors or chokes that dampen the oscillatory transient to a manageable level
- UPS
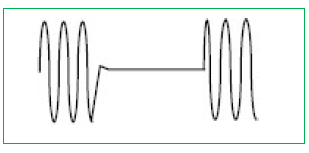
Interruptions
An interruption is the complete loss of supply voltage or load current. Depending on its duration, an interruption is categorized as instantaneous, momentary, temporary, or sustained.
Voltage Sag Classification
| Type | Voltage Level (p.u.) | Duration |
|---|---|---|
| Instantaneous | 0.5 to 1.0 | 0.5 to 30 cycles |
| Momentary | < 0.1 | 30 cycles to 2 seconds |
| Temporary | < 0.1 | 2 seconds to 2 minutes |
| Sustained | 0.0 | Greater than 2 minutes |
- Electrical supply grid damage
- Equipment Failure
- Basic Circuit Breaker Tripping
Effects
Disruption, damage and downtime from the home user up to the industrial user Many Industrial processes count on the constant motion of certain mechanical components. When these components shutdown suddenly from an interruption, it can cause equipment damage, product damage, as well as the cost associated with downtime, clean-up, and restart.
- UPS
- Motor Generator
- Use of system techniques that take advantage of redundant systems and energy storage When the power goes out, these forms of alternative power can take over.
Sag
Sag is a reduction of AC voltage at a given frequency for the duration of 0.5 cycles to 1 minute’s time.
- System faults
- Switching on loads with Heavy start-up currents
- Damaged equipment
- Data corruption
- Errors in industrial processing
- Adding a dedicated circuit for large start-up loads. (it is not very practical or economical)
- Reduced-voltage starters, with either autotransformers, or star-delta configurations or a solid-state type of soft starter
- Adjustable speed drives (ASDs), which vary the speed of a motor in accordance with the load (along with other uses). It also addresses the problem of large motor starting.
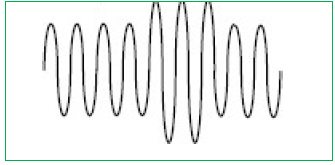
Swell
A swell is the reverse form of sag, having an increase in AC voltage for duration of 0.5 cycles to 1 minute’s time.
- High-impedance neutral connections.
- Sudden (especially large) load reductions
- single-phase fault on a three-phase system
- Data errors
- Flickering of lights
- Degradation of electrical contacts
- Semiconductor damage in electronics
- Insulation degradation
- Power line conditioners
- UPS systems
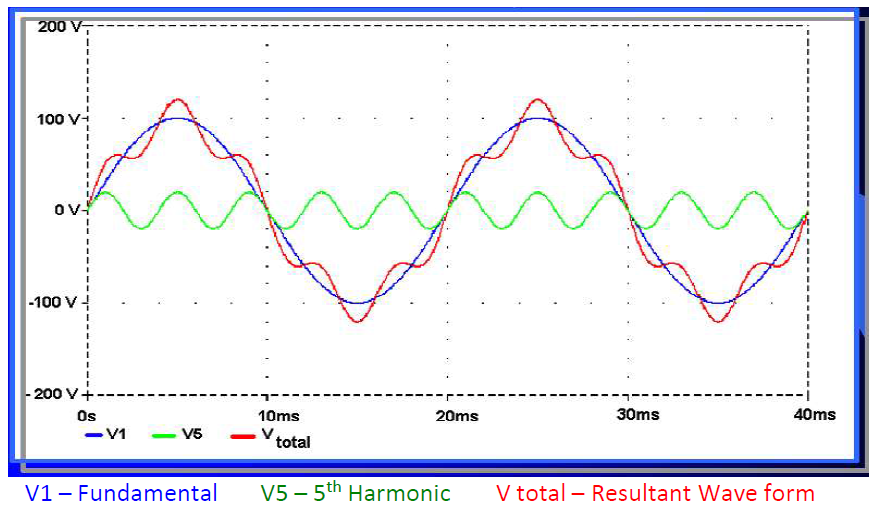
Harmonics
Harmonic is defined as a Component of periodic wave (or a signal) whose frequency is integral multiple of the fundamental frequency. The typical 5th harmonic distortion is given below:
Electrical loads can be classified as linear and non-linear loads. A linear load is one, which draws a sinusoidal current when subjected to sinusoidal voltage. The current wave may or may not have a phase difference with respect to the voltage. A pure resistance, inductance or capacitance or any combination of these forms a linear load. On the contrary, a non-linear load is one, which draws nonsinusoidal or pulsating current when subjected to sinusoidal voltage.
Any non- sinusoidal current can be mathematically resolved into a series of sinusoidal components (Fourier series). The first component is called as fundamental and the remaining components whose frequencies are integral multiples of the fundamental frequency are known as harmonics. If the fundamental frequency is 50 Hz, then 2nd harmonic will have a frequency of 100Hz, and the 3rd will have 150Hz and so on.
Non-linear loads that draw current in abrupt pulses rather than a smooth sinusoidal manner create harmonics. The pulses of current cause distorted current wave shape, which in turn cause harmonic currents to flow back into other parts of the power system.
Voltage Harmonics
The harmonic current drawn by non-linear loads acts in an Ohm’s law relationship with the source impedance of the power supply. The interaction of harmonic current with the source impedance will create Harmonic Voltages in the network (Harmonic Voltage = Harmonic current x Source impedance at harmonic frequency). The source impedance includes the Impedance of the power source (Transformer, Generator, and Grid etc.), Impedance of the Bus bars, Cables, Switchgears, and other loads in the network.
Sources of Harmonics
As mentioned earlier the reason for harmonic current is the wave chopping phenomena in various non-linear loads. Some of the potential sources for harmonic current distortions are as follows:
Following are some of the non-linear loads, which generate harmonics:
- Static Power Converters and Rectification circuits, which are used in UPS, Battery chargers, etc. Arc Furnaces.
- Power Electronics for motor controls (AC / DC Drives.) Computers.
- Television receivers.
- Saturated
- Transformers. Fluorescent Lighting.
- Static Power Converters and Rectification circuits, which are used in UPS, Battery chargers, etc. Arc Furnaces.
Effect of Harmonics
Insulation stress and Thermal stress
The insulating stress depends primarily on the instantaneous voltage magnitude & rate of change of voltage (or dV / dT). The presence of voltage harmonics can result in an increase of Peak value of the voltage and thus increased insulation stress. In most of the cases, the increase in peak is not of concern for most power system apparatus because they are insulated for much higher voltage levels than those usually encountered from harmonics.
Effect on Capacitors
The major effect of higher voltage distortion is on the power capacitors power electronics used in the network. The presence of higher voltage distortion will increase the di-electric stress in the capacitors and consequently the life of the capacitor will reduce drastically. The capacitive reactance of the capacitor is inversely proportional to the applied frequency. Consequently, the magnitude of the capacitive reactance will reduce with frequency due to which the capacitor will act as a Sink for higher harmonic currents and absorb the harmonic current into it. The flow of higher harmonic current in the capacitor will increase the losses and consequently the di-electric will undergo higher thermal stress along with the voltage stress. As the life of the insulation is inversely proportional to the thermal stress, premature failures of capacitors are common.
Harmonic Loss due to skin effect
Skin effect is a phenomenon in which, the high frequency AC current will tend to flow in the outer periphery of the conductor due to internal inductance effect, leaving the central portion of the conductor empty. Due to skin effect, the current will tend to flow in the outer periphery of the conductor. The skin effect will increase the effective resistance of the conductors and consequently I2R losses in the conductors will increase manifold. Increase loss generates excess heat in the conductors, terminations, switchgears and may cause nuisance tripping of breakers.
Effect of harmonics on rotating machines (Induction motors, Alternators etc.)
The Iron loss in any AC rotating machines depends on the applied voltage, frequency of magnetic flux in the core and the Flux density itself. The Iron loss is proportional to the Frequency to the power N (where N is a number), and maximum flux density. The presence of harmonic voltage in the applied voltage will alter the Wave shape of the magnetic field in the rotating machine’s magnetic circuit. The magnetic circuit will be subjected to high frequency magnetic fields due to which the Eddy current and the Hysteresis losses will increase. The other loss in the rotating machines is due to skin effect.
Effect of harmonic distortion on Sensitive Electronics
The sensitive automation equipment used in the process industries are designed for a given rate of change of voltage (dV/dT) and are also programmed to work with reference to zero crossover of the voltage waveform. The presence of higher harmonic distortion will create a significant magnitude of dV/dT, which may result in mal-function, and/or failures of sensitive electronics used in the Automation system. The presence of higher harmonic distortion may shift the zero crossover of the applied voltage waveform. This may result in misfiring of thyristors used in DC / AC drives, UPS, Rectifiers etc. due to which the system may mal-function and/or damage permanently.
Outcome of Harmonics
- Blinking of Incandescent Lights – Transformer Saturation
- Capacitor Failure – Harmonic Resonance
- Circuit Breakers Tripping – Inductive Heating and Overload
- Computer Malfunction or Lockup – Voltage Distortion
- Conductor Failure – Inductive Heating
- Electronic Equipment Shutting Down – Voltage Distortion
- Flickering of Fluorescent Lights – Transformer Saturation
- Fuses Blowing for No Apparent Reason – Inductive Heating and Overload
- Neutral Conductor and Terminal Failures – Additive Triplen Currents
- Overheating of Metal Enclosures – Inductive Heating
Amplification of Harmonics
Power factor capacitors are sensitive to harmonic and shunt connected capacitors to forms a parallel resonance circuit with the load & series resonance circuit with power transformers. Shunt connected power factor correction capacitor amplifies the harmonics to a higher level, due to the combination of series and parallel resonance. This amplification of harmonics leads to damaging effects on the total distribution system. In this type of harmonics loads, the effectiveness of power factor correction by the power capacitors is not possible and the distribution deterioration including capacitors will be faster.
Instruments Used
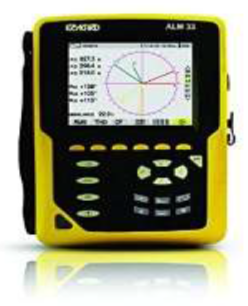
Krykard AL36 Power Analyser
The AL36 Series II Power Quality Analyser is a high-performance 3-Phase 4 CT Portable Energy and Harmonics Analyzer, specifically designed for in-depth power quality analysis, energy audits, and maintenance studies. Equipped with the capability to connect up to 4 current transformers (CTs) and 5 voltage inputs, this advanced analyzer provides comprehensive and accurate measurement of electrical parameters. It allows for the monitoring of key power quality indicators such as voltage, current, frequency, power factor, harmonics, energy consumption, and more. With its robust design and user-friendly interface, the AL36 Series II is ideal for use in industrial, commercial, and utility environments. The device features a large in-built 2GB memory, enabling long-duration recording of data for detailed analysis and reporting.
- True RMS AC Voltage – Single voltage up to 480V; phase-phase voltage up to 600V
- True RMS AC Current up to 6500 Amps
- DC measurements with optional CTs
- Peak Voltage and Current
- Frequency Measurement
- Active, Reactive, and Apparent Power per phase and aggregate
- Active and Reactive Energy – Consumed and Produced (Export / Import)
- Harmonics for Voltage and Current up to the 50th Order
- VA Harmonics up to 50th Order
- Flicker Measurements
- Harmonic Source Identification – Generated or Received with Zero, +ve and -ve Sequences
- Neutral Current Measurement
- Crest Factor for Voltage and Current
- K Factor for Currents
- Voltage and Current Unbalance in %
- Total Harmonic Distortion (THD) Factor
Different Graphs at Main Incomer
Voltage Vs Time
The 3-phase voltage varies from 386.2V to 455.4V under various load condition.
Current (Amp)Vs Time
The current varies from 180A to 447 A .
Real Power, Apparent Power and Reactive Power (W, Var, VA)
Apparent Power varies from 22kVA to 340 kVA
Reactive Power varies from -44kvar to 255 kVAr
Power Factor
The power factor varies from -0.98 to 0.991.
Voltage harmonics (Vthd%), Current Harmonics (Ithd%)
The voltage harmonic distortion (Vthd%) is varies from avg 0.5% to 2 %.
The Current harmonic distortion (Ithd%) is varies from avg 9 % to 39%.
Voltage and Current Harmonic Limits level (IEEE519-2014)-
Table 1—Voltage distortion limits
| Bus voltage V at PCC | Individual harmonic (%) | Total harmonic distortion THD (%) |
|---|---|---|
| V ≤ 1.0 kV | 5.0 | 8.0 |
| 1 kV < V ≤ 69 kV | 3.0 | 5.0 |
| 69 kV < V ≤ 161 kV | 1.5 | 2.5 |
| 161 kV < V | 1.0 | 1.5a |
Table 2—Current distortion limits for systems rated 120 V through 69 kV
| ISC/IL | Maximum harmonic current distortion in percent of IL |
|||||
|---|---|---|---|---|---|---|
| 3 ≤ h < 11 | 11 ≤ h < 17 | 17 ≤ h < 23 | 23 ≤ h < 35 | 35 ≤ h ≤ 50 | TDD | |
| < 20c | 4.0 | 2.0 | 1.5 | 0.6 | 0.3 | 5.0 |
| 20 < 50 | 7.0 | 3.5 | 2.5 | 1.0 | 0.5 | 8.0 |
| 50 < 100 | 10.0 | 4.5 | 4.0 | 1.5 | 0.7 | 12.0 |
| 100 < 1000 | 12.0 | 5.5 | 5.0 | 2.0 | 1.0 | 15.0 |
| > 1000 | 15.0 | 7.0 | 6.0 | 2.5 | 1.4 | 20.0 |
The limits of Individual Voltage harmonics up to V≤1kV is 5% and total Harmonics distortion for Voltage is 8%. (Refer Table 1)
The current TDD harmonic limits for Isc/IL(50 < 100) is 12% and total (Refer Table 2)(Considered Short Ckt level 36kA and Full load Current is 447A)
Overall Summary and Recommendation -
| Parameter | Vthd % | I thd % | 3 | 5 | 7 | 9 | 11 | 13 | 15 | 17 | 19 | 21 | 23 | 25 | 27 | 29 | 31 | 33 | 35 | 37 | 39 |
|---|---|---|---|---|---|---|---|---|---|---|---|---|---|---|---|---|---|---|---|---|---|
| Value | 1.5% | 69% | 9.5 | 50 | 29 | 2.4 | 18 | 14 | 0.4 | 2.9 | 1.9 | 3.3 | 3.1 | 3.3 | 0.4 | 0.3 | 0.9 | 0.9 | 0 | 0 | 0 |
| FEEDER NAME | MAIN INCOMER | ||
|---|---|---|---|
| Solar ON and APFC ON | APFC ON | APFC OFF | |
| V L-L(V) | 415 | 413 | 415 |
| Current(I) | 81 | 274 | 385 |
| kW | 44 | 182 | 235 |
| kVA | 54 | 183 | 286 |
| kVAr Lag | 30 | 6.5 | 137 |
| PF | 0.81 | 0.991 | 0.82 |
| Vthd% | 1.5 | 0.9 | 1.2 |
| Ithd% | 69.1 | 12.6 | 13 |
Recommendation-
As per Harmonic analysis Current Harmonic distortion (THD) is 61 % which is beyond the IEEE 519 2014 limits (Limit is 12%), so required to install 220A Active Harmonic Filter in the line which will mitigate the Harmonic within IEEE 519 2019 limits